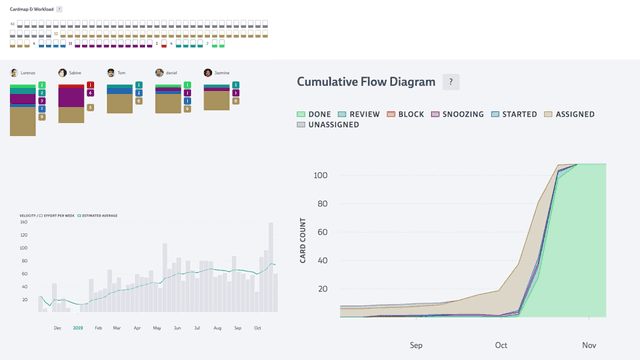
All the answers you need
Will we hit the next milestone? Is the workload evenly distributed? How reliable are our effort estimates? Our metrics are a good starting point to answer this kind of questions.
Drill down on the tasks that matter
Metrics can be accessed for different levels within your project. Either for a single deck, a milestone or your whole project. You’re even able to filter further using our search widget.

What's the overall state of the project?
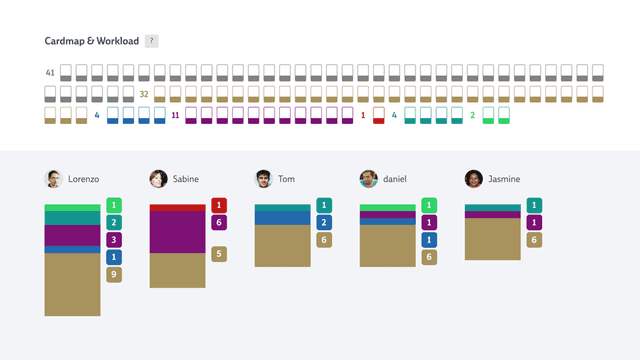
The cardmap & workload metric gives you a top-down overview over the total load and who is bearing most of it. The color code indicates the status of each individual card.
Burn those cards
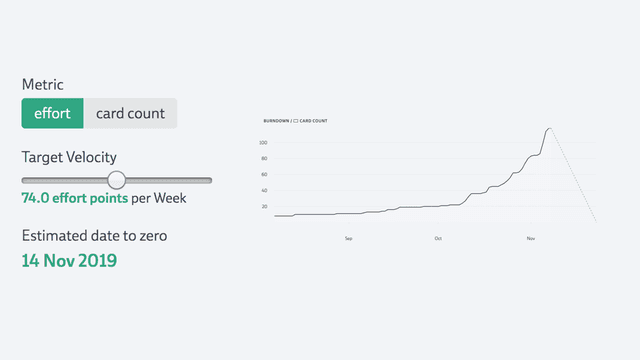
The burndown chart helps you see the buildup and burndown of your workload. Depending on your needs you can use your effort points or simply the card count as unit of work. The “target velocity” slider allows you to see how much work per week is necessary to meet the next milestone. Compare it with your past velocity to get an idea of how reasonable that estimate is!
How has the project developed?
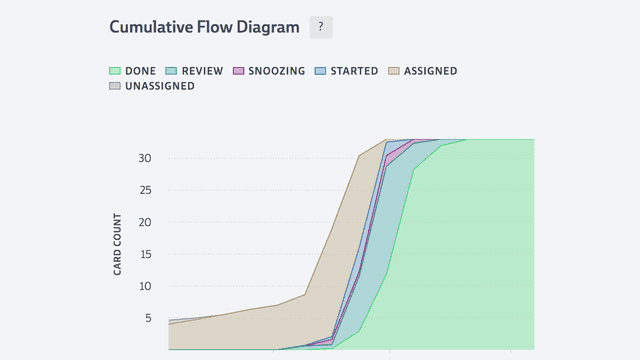
Curious about the overall development of your deck, milestone, or project? The cumulative flow diagram helps you get a feeling for your progress.


